2D or 3D Histogram Analysis
At the core of the Colocalization module is 2D or 3D histogram analysis. To establish a 2D histogram, a collection of voxels is analyzed, often the entire image. Each of the voxels becomes a point in the 2D histogram. The X coordinate is the intensity of the voxel in one channel and the Y coordinate is the intensity in the other channel. Channels can be analyzed in sets of two or three.
View a report.
|
 |
 |
| |
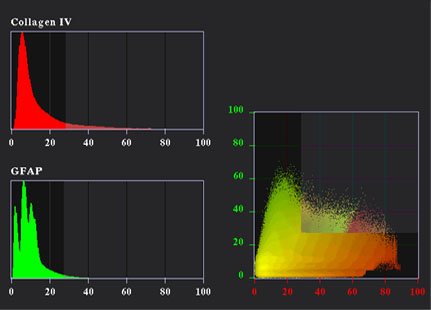
| The figure on the right shows a 2D histogram, which combines two channels. Note the area selected by the square. It is displayed as two individual channel histograms on the left. The X coordinate displays intensity in the first channel. The Y coordinate displays intensity in the second channel. |
| |
|
|


