[an error occurred while processing this directive]


 |
|
 |
|
|
| |
 |
|
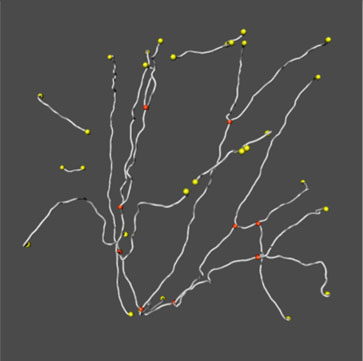
2. NeuronTracer automatically converts the volume image into a vector-based image — a graph. Spines have been filtered out and only the backbone segments shown. This structure preserves the topology of the dendritic tree and stores relevant geometrical information such as the length of the centerline, the diameters of the segments and precise location in 3D space. The orientation in 3D space is facilitated by NeuronTracer's stereo option.
3. Using a viewer combines the volume image with the graph. The accuracy of the tracing can be inspected at any magnification and the graph improved by manual editing. For example, gaps that result from incomplete staining can be closed.
4. Starting at a user-defined node, NeuronTracer automatically assigns branch level orders using different modes (centrifugal, centripetal, etc.). Branch levels are shown using a color code for each level.
5. Statistical information about a selected portion of the image is displayed in the selection dialog box.
|
 |
 |
|
|